Recently we set out how we think about risk:
- There are two dimensions of investment risk.
- There are two levers you can use to help manage that investment risk.
The two dimensions of investment risk that we outlined in that recent piece are:
- The risk of permanent loss of capital, and
- The risk of underperforming your target return or benchmark.
All of the other “risks”, including the risks we have to list in our formal fund documents, are just sub-sets or causes of those two over-arching risks.
Now in this piece we’ll look at the two levers you can use to measure and manage that investment risk. Then in a later piece we’ll look at some of the behavioural, or emotional, aspects of managing investment risk.
Managing Risk Is About Balancing Time And Probability
Essentially risk is about uncertainty. Riskier investments are the ones where your investment has a range of possible outcomes spanning from good to bad, and you’re not certain what eventual future outcome you’re going to end up with.
We handle uncertainty – in many areas of life, not just in investing – using probabilities. So we need to think about what are the probabilities of these different possible outcomes? And do those probabilities change over time?
First, Probability
We mainly think about risk in terms of probability distributions – specifically the probability distribution of the fund’s historical returns.
You’ll be used to how funds post annual return numbers, which are simply the “through 12-months return” calculated at the end of the fund’s financial year. But we can calculate the “through 12-months return” every day and so for this fund we have over 1,200 individual “through 12-months” data points from both bull-ish and bear-ish periods. With a sample size that large we can arrive at the probability distribution of the Fund’s returns with some confidence. What we find is that the distribution of these “through 12-month returns” fits to a bell curve (1), and the shape of that bell curve gives a simple visual picture of the Fund’s risk and return profile.
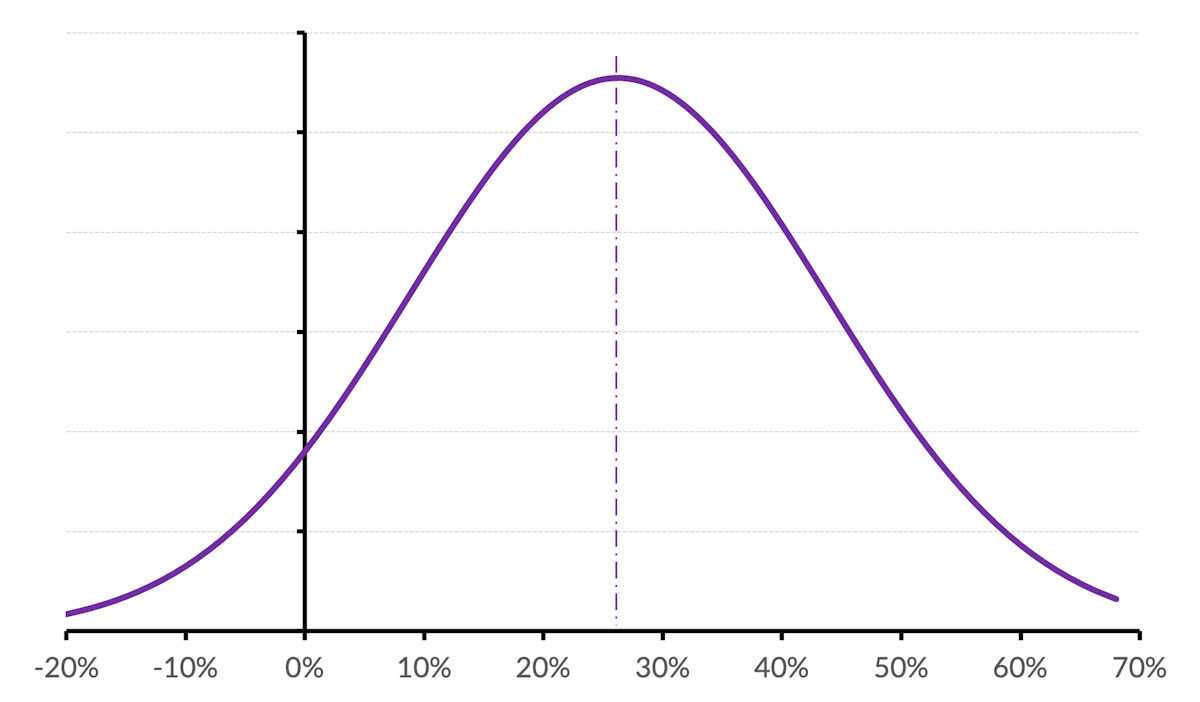
For our Lighthouse Global Equity Fund the probability distribution of the “through 12-month” returns is:
Let's mark-up that diagram with a few notes that highlight risk and return.
Based on the historical performance – in the historical conditions – the fund has about a 6% probability of losing money in any 12-month period. We expect that will be understating the true risk of a losing year because the period we’re measuring across has been a good one in the markets. As, if, and when we pass through the next deep market correction these probabilities will shift and that probability of a losing year will rise. But the method, or approach, we’re using to think about it won’t change (2).
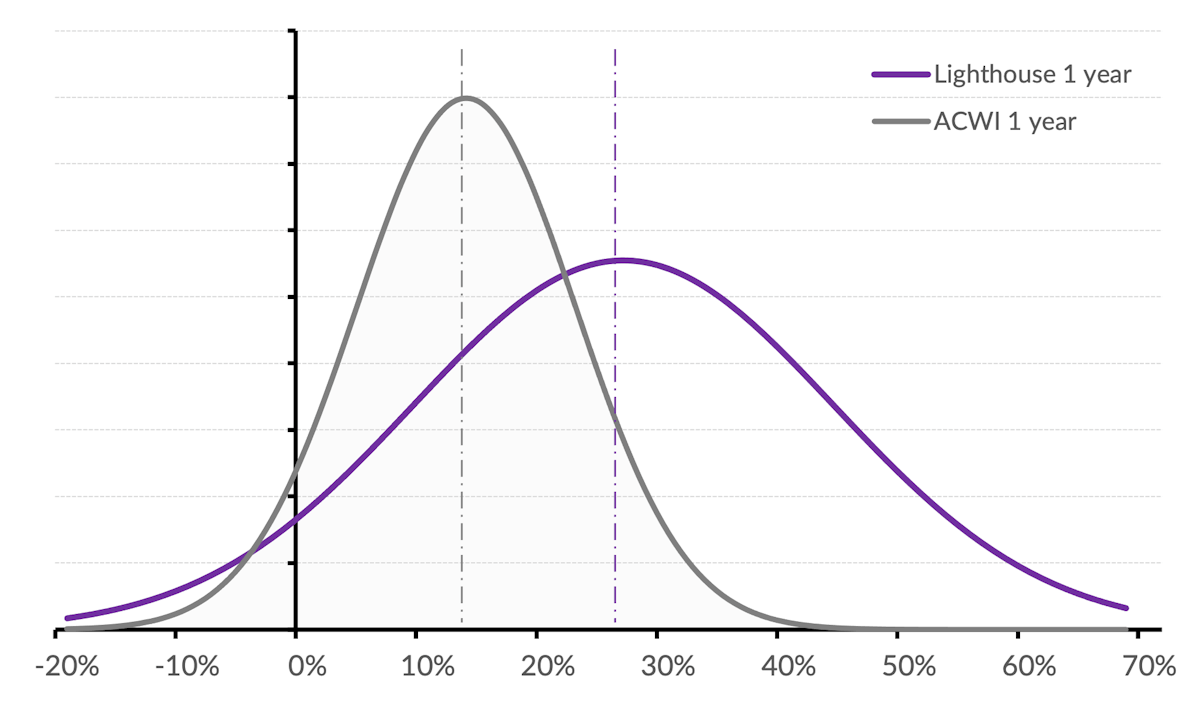
Now let’s overlay the equivalent bell curve for our benchmark index, the MSCI All Country World Index (the ACWI).
The bell curve of the fund’s returns is wider, or flatter, than for the ACWI, which tells you that the fund is more volatile than the ACWI. The standard risk indicator, which measures volatility not risk, rates the ACWI a 5 and this fund a 6.
But the proportion of the ACWI’s bell curve that’s to the left of the 0% line (to the left of the vertical axis), is actually the same as for the fund. Both have about a 6% probability of a losing year. So despite the fund being more volatile the numbers suggest that in terms of the risk of permanent loss of capital the fund is no riskier than the ACWI index. As we’ve said before, volatility is not risk.
Where the fund’s wider and flatter bell curve shows a difference is that the fund is more likely to have strongly positive returns than its benchmark index might. The two bell curves suggest that the ACWI will rarely deliver a 40% return in any 12-month period, but meanwhile it’s quite possible for the fund to return 40%, or more, in a 12-month period.
So comparing these two bell curves suggests the fund is more volatile than its benchmark index, but that volatility is concentrating towards the upside, and in fact the fund’s risk of a losing period is about the same as for the index.
There’s more insights to draw from these probability distributions, but we’re trying to be brief so we’ll come back to those in a later piece.
Second, Time Horizons
Share markets have periods where they lose ground. History shows that in more than half of all years the S&P500 will have a drawdown of at least 10%, and in about one year in five it has a drawdown of more than 20%.
Yet equity markets’ long game is consistently positive. This Fund hasn’t had a 2-year period where it lost money. It hasn’t had a 3-year period where the annualised return wasn’t in double figures.
So investing in equities means handling periods where your investment goes backwards, but the odds of positive returns improve as your time horizon lengthens. Essentially, the shorter your time horizon the higher the probability you will experience losses. And the longer your time horizon, the higher the probability you will experience gains.
So when we consider the possibilities of losing money, or of underperforming we need to ask “Over what time period?” We wrote earlier about how to think about investment timeframes, and you’ll see from that piece that our thinking on investment horizons links back to these questions of risk. They’re two sides of the same coin.
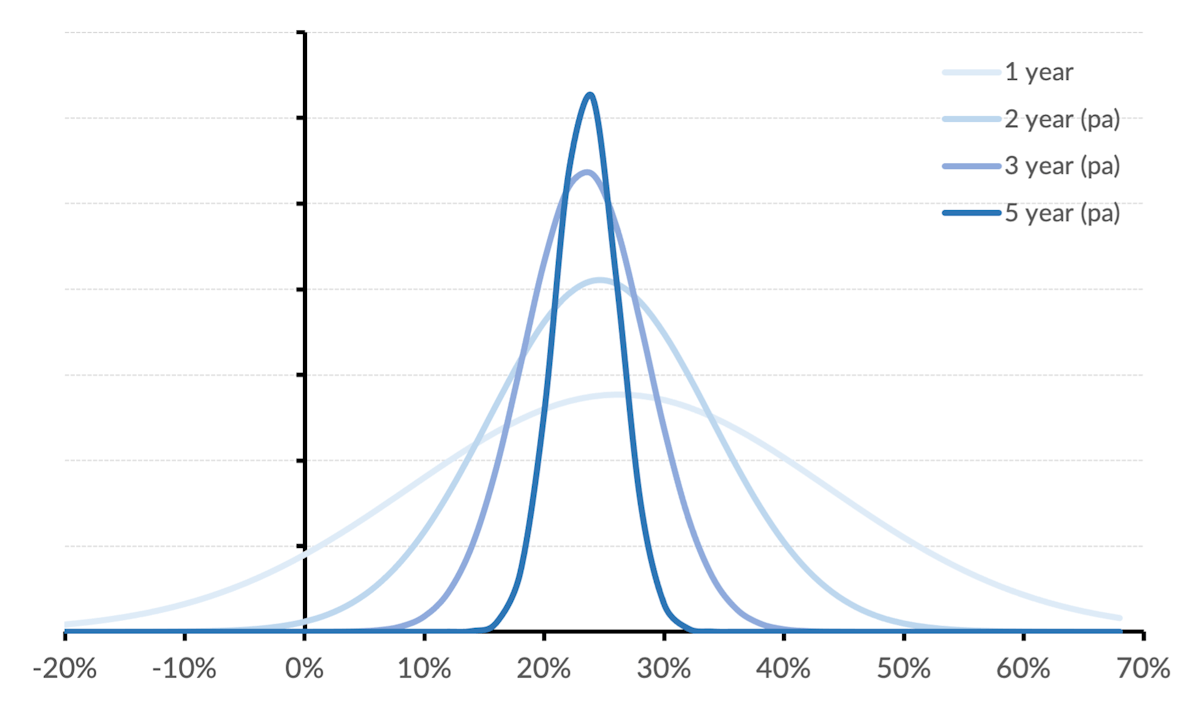
This chart shows how the probability distribution – the bell curve – of the Lighthouse Global Equity Fund changes with longer and longer time periods.
The lightest shaded bell curve is the one we showed earlier – it’s the distribution of the fund’s returns for 12-month hold periods. A meaningful portion of that bell curve lies to the left of the vertical axis, which says we should expect some 12-month hold periods to lose money.
But as the hold period lengthens (indicated by darker and darker shades of blue in the chart) the probability distribution narrows and becomes peakier. The long-run returns are more consistent and certain – they’re less risky. Little or none of those bell curves lie to the left of the vertical axis – the risk of permanent loss is reducing quickly as we hold for longer periods.
What this chart highlights is that risk is linked to time. The shorter your hold period the riskier your investment will be. Patience is one of the best tools for managing risk.
The Future
No doubt you’ve heard the standard proviso that “past performance is no guarantee of future performance”.
It is true the future might not be the same as the past, so yes a high probability for success based on historical returns is no absolute guarantee. But what is a better alternative measure for weighing risk and return? Volatility is a poorer and less relevant measure of risk, and if you truly think the future could be different from the past then who’s to say the future volatility won’t be materially different to the historical volatility? Why is the historical volatility any better a predictor of the future than the historical investment returns?
We try to be pragmatic. Every fund manager has their own individual investment style. Every investment style has an inherent rate of return and an inherent risk (or probability distribution) of permanent loss or underperformance. We believe the best way to see that inherent rate of return and level of risk is by looking at that fund manager’s 5-year, or longer, historical investment returns.
(1) We could talk about – and will cover in a separate piece – multi-modal distributions, and skew, and “fat tails”, and so on. We’re nerdy enough to get into that stuff. But we’re also trying to make these pieces accessible too. The fit to a bell curve is very good, so although it’s a slight over-simplification we’ll use it in this piece because most people will be familiar with normal distributions.
(2) These charts are based on the audited returns from our wholesale and retail funds since 2015. But if we look over a longer history of investing with this approach we estimate the risk of a losing 12-month period will be about 10% over the full market cycle, or about 1 year in 10.