Key points
- To get high returns over the long-run you need to accept there'll be periods with losses in the short-term - it's the price of admission.
- In fact most of the time your investment will be under its most recent high.
- But your investment will return to new highs in the future, typically quite quickly.
Investing in the share market is emotionally trying.
As we write this, in early-2022, the major global indexes are abruptly off their recent highs. The mood of the market has swung strongly bearish - in fact surveys of investor sentiment are as negative now as they were in March 2020, which seems scarcely credible when you think back to March 2020.
Investors in our Lighthouse Global Equity Fund have seen larger falls than those of the indexes. The fund has a very clear strategy that is different to the market-as-a-whole. History shows that that different strategy delivers higher long-term returns than the market does. But there are times when your different will be out of step with the market and this is one of those times. We expect and accept that because we’re focused on the long-term returns.
But we know these times in the market are emotionally trying, so we thought it would be useful to talk through three truths of investing in equities.
Short-Term Losses Are The Price You Pay For Long-Term Gains
Over the long-run the share market offers strong returns. Across the last 5 years our benchmark index, the MSCI All Country World Index, has averaged nearly 15% pa in New Zealand dollars. In the same timeframe our Lighthouse Global Equity Fund has averaged more than 25% pa. That’s the sort of story we’re all here for as investors.
But in the short-term the share market will have deep retreats. Like we’ve seen recently. They’re not rare - you should expect that every year the market, and your investments, will have a significant pullback, that every second or third year it will have a correction, and that every six to ten years it will have a crash (1).
Truth #1 = To get high returns over the long-run you need to accept there will be losses in the short-term. The short-term losses are the price of admission. The long-term gains are despite those short-term retreats.
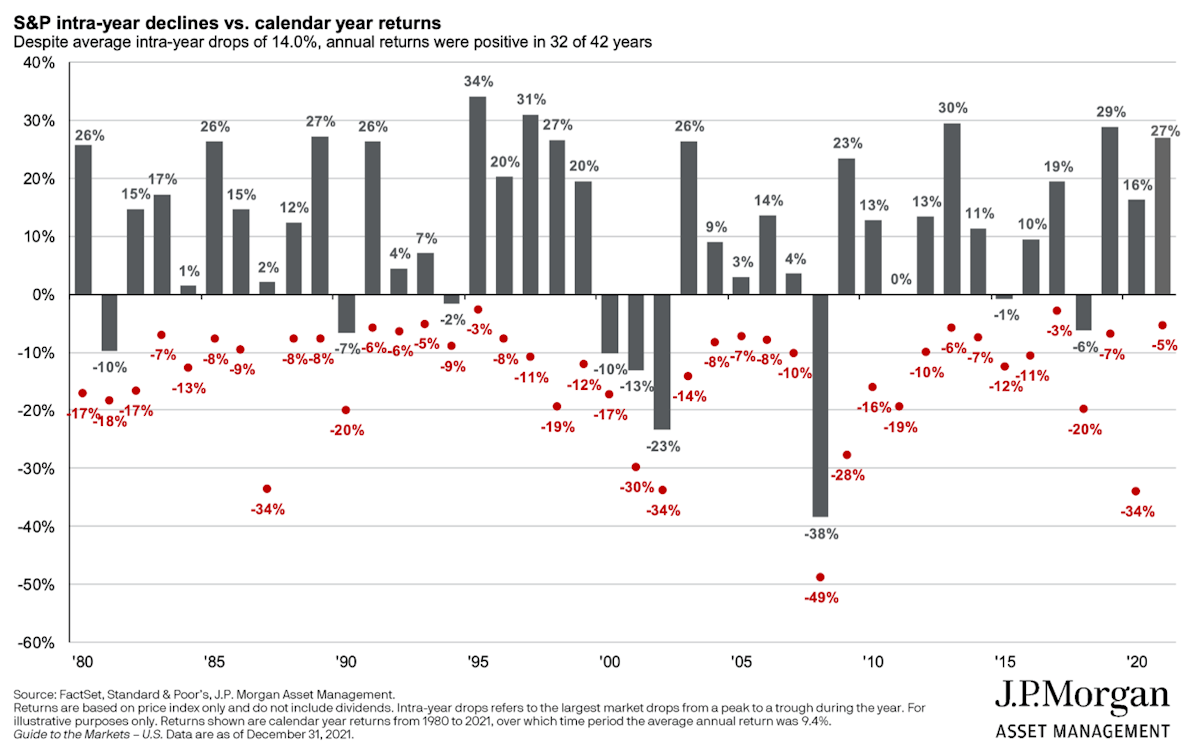
There’s a chart in JP Morgan’s excellent “Guide to the Markets” that shows this clearly.
The grey columns show the annual return for the S&P500 for each calendar year since 1980. The red dots show the extent of the largest decline, or retreat, in each of those years. Over the 42 years covered in the chart the S&P500 has averaged 9.4% pa (in US dollars). But that’s despite declines each year that averaged 14%.
Investing for long-term returns requires the fortitude to stomach short-term setbacks.
Most Of The Time Your Investment Will Be Below Its Highs
Given this Fund’s strong long-term returns you might think it’s normal for most days to lift higher and higher. Not so. Not even close.
This Fund began on the 31st of March 2016. In the 1,530 business days since then the Fund’s unit price has set a new high on just 186 of them. So all of the 25% pa net return across nearly 6 years was generated on just 12% of the days the Fund has been in place.
For the other 88% of the days the Fund was below its most recent high point. On average, across time, the Fund has been about 6% below its most recent high.
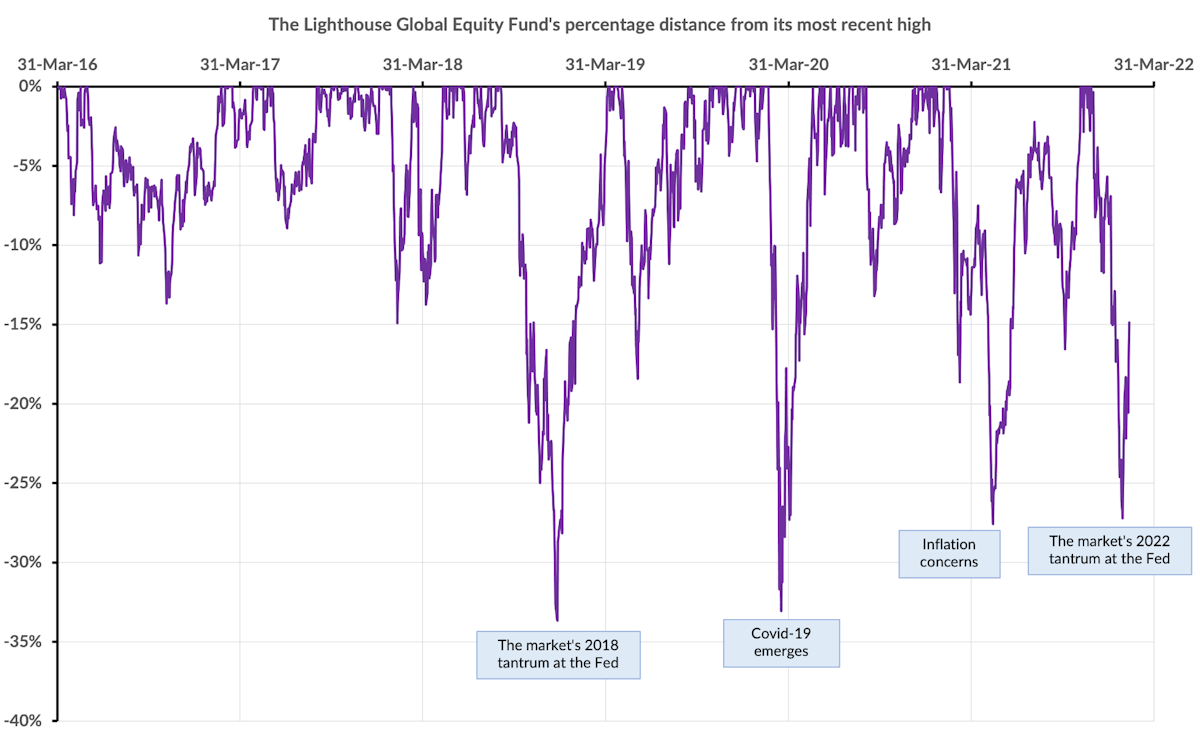
When we chart the Fund’s distance from its most recent highs it looks like this.
These charts are likely a little confusing so let us explain what it shows. If the purple line is touching the top of the chart then that’s a day the Fund’s unit price hit a new high (so when the Fund is 0% off its most recent high). If the purple line is below the top of the chart then that’s when the Fund’s unit price has dropped below its most recent high. You’ll see the Fund spends most of its time below the top of the chart, or in other words it’s below its most recent high – that’s the "88% of the time" statistic we just mentioned. For this Fund the longest gap between new highs was 38 weeks, or 9 months. And the slowest recovery from the bottom of a big drop was 25 weeks, or 6 months.
Truth #2 = Most of the time your investment will be lagging its high point.
Truth #3 = Your investment will return to new highs in the future, typically quite quickly.
It’s Not Only This Fund That Shows This Pattern
This isn’t the case with just this Fund - the chart looks fundamentally the same for each index and for most individual stocks. That is the reality of equity investing - your investments will spend a lot of time notionally “under water” but they will recover. Equity markets have a strong upward bias and they deliver positive long-run returns.
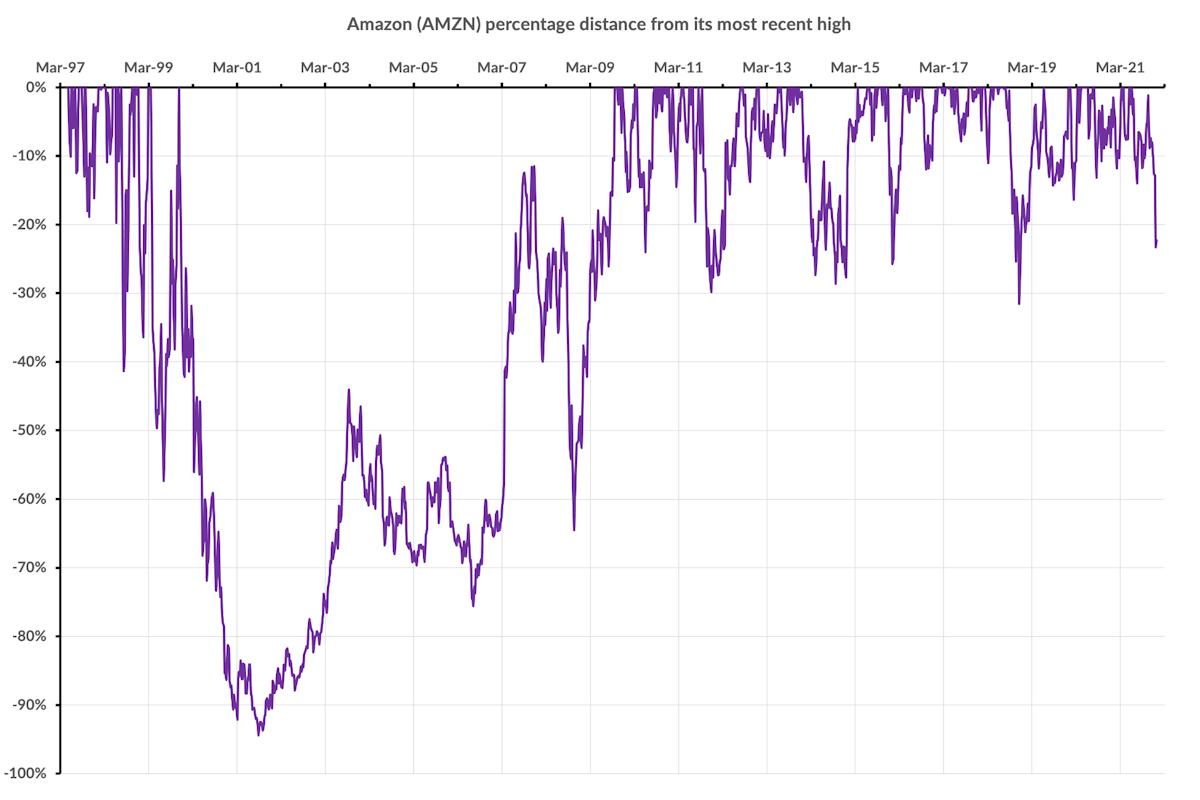
Amazon listed in May 1997 at about US$1.70 per share (when we adjust for share splits since then). Now, in February 2022, Amazon’s shares are worth about US$3,100. That’s a return of more than 35% pa across almost 25 years. We’d probably all like to find a DeLorean time machine, go back to May 1997, and load up on Amazon shares in the IPO.
But the “Percent distance from most recent high” chart for Amazon looks like this:
In the aftermath of the 2000 dot-com crash Amazon’s shares fell by 94%. Very few investors could calmly tolerate that level of crash. And it took 10 years - from November 1999 until October 2009 - for Amazon’s shares to recover and post a new high above its 1999 level. Amazon’s shares have hit new highs on only about 12% of the days since Amazon listed - so across time Amazon’s new highs have been about as rare as we find they are with this Fund.
And even today Amazon’s shares are more than 15% off their most recent high, which was in July 2021.
But still … 35% pa for almost 25 years.
Likewise, if you’d held Apple shares since its IPO you would have travelled through six different periods where Apple’s share price was more than 50% below its most recent high, with a worst drawdown of 82%.
Truth #1 = The long-term gains are despite the short-term retreats.
Truth #2 = Most of the time your investment will be under its most recent high.
Truth #3 = But your investment will rebound to make new highs in the future.
The Key To Successful Investing
Successful investing relies on being patient and managing your emotions. The hardest aspect of managing your investing emotions is learning to ride the market’s turbulence.
When the market is dropping to significant lows the human emotional reaction is to sell. That’s why “Buy low, sell high” is a beguilingly simple maxim, because while your head will recognise the logic of that phrase at the times when it really matters your emotional state will make doing that logical thing hard.
But history shows those occasional lows are great entry points, and bad exit points. This Fund’s slowest bounce-back was 6 months to regain a 25% loss. So an investor who added money at that low made 33% in 6 months.
Meanwhile panicking and selling at that low point just means you are locking in that loss.
- There’s various definitions used to describe different levels of market fall. We use “pullback” to describe a fall of 10%-20% from the most recent high, “correction” where the fall is 20%-30% from that most recent high, and "crash" where the fall is more than 30% .
Note: The content provided here is written by us, Lighthouse Funds, as general information that we trust is helpful and informative. It’s based on information that we believe to be accurate and reliable, although we can’t guarantee that this is the case. It isn’t intended to be personalised advice for any investor, or class advice for any group of investors. We recommend that before entering into any investment you first seek advice from a financial advisor who can give you professional advice that takes into account your objectives, needs, financial situation and circumstances. Please see our disclaimer.