We introduced our fund for retail investors, the Global Equity Fund, in April 2021 but we’ve been running effectively the same fund for five years before then, although only for wholesale investors. The two funds share the exact same investment approach and philosophy, but the key difference between them is that the retail fund is a unit trust and PIE while the wholesale fund was a limited partnership.
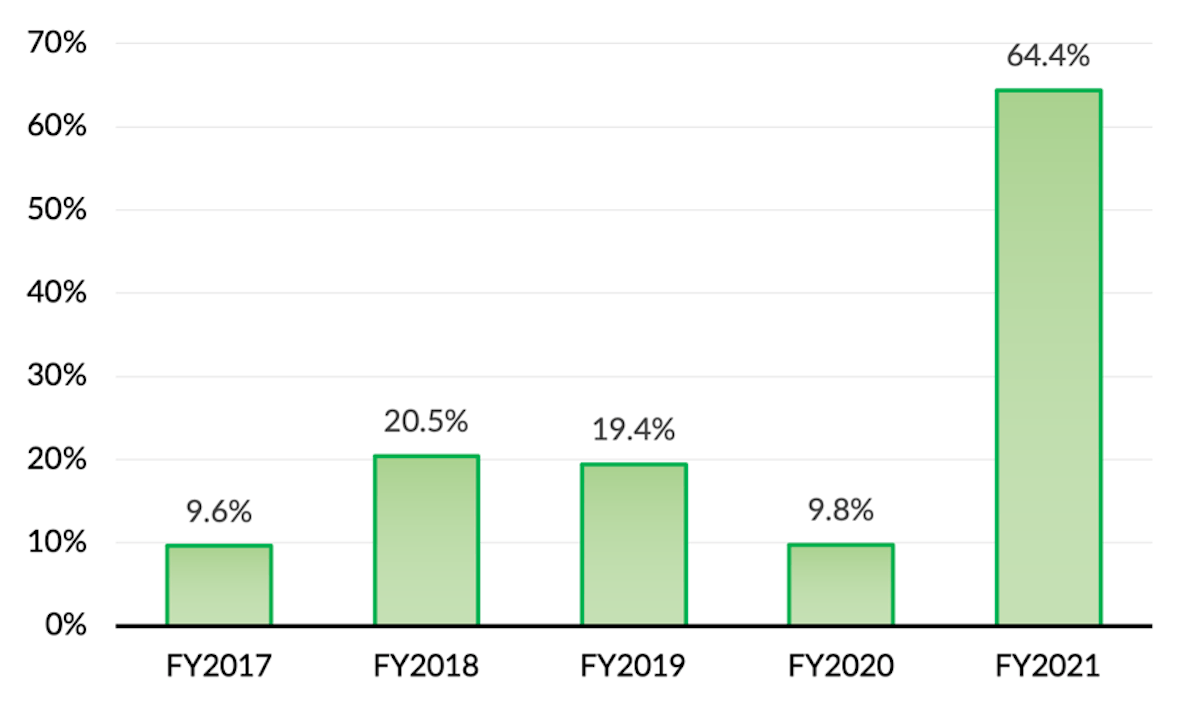
But we can use the audited performance figures for the wholesale fund to show you what the Global Equity Fund would have returned to retail investors if they’d been able to invest in it in the five years from April 2016 to March 2021. Those pre-tax net returns would have been:
The compound average pre-tax net return across this five year period was 23.3% pa.
There are two things we’d like to highlight.
Firstly, this period from 2016 to 2021 has been the latter part of a bull market and hasn’t included any significant market crash, so the returns shown here are perhaps a little rosier than they’d be across the full market cycle. Our rough estimate is that the compound average net return shown here is about 1.5% pa higher than it would be across a full cycle that included a crash and the subsequent recovery period.
Secondly, we recommend concentrating on the average returns rather than on the returns in any particular year. The figures shown here are for New Zealand tax years, so they run from April to March. But if you were to show the returns for calendar years, for example, the results for the individual years would look different but, importantly, the average returns across three years or five years would remain the same.
The obvious example of this is how the FY2021 returns are noticeably higher than the other years. That’s an anomaly due to Covid-19, because sharemarkets dropped markedly in the six weeks from mid-February 2020 to the end of March 2020, only to recover strongly from April 2020 onwards. Effectively that moved a block of returns out of FY2020 and into FY2021.
You can see that clearly if you compare the 12 month periods to the end of January with the 12 month periods to the end of March:
The two 12 month periods to the end of January are quite consistent, but if you look at the 12 month periods to the end of March you see this big gap open up between returns for the two years. Our recommendation then is to focus more on the three year and five year averages rather than any one 12 month period.
We’ll write again soon on the performance measures that we focus on, which give better insights into both performance and risk.