A Quick Recap
In part 1 we urged readers to focus on net returns after tax - because that’s what you, the investor, get to keep. And we pointed out that focusing on the differences in fees is mis-directed because any difference in fees between managers is very small compared to the differences in their gross (pre-fee) returns.
In this part 2 we want to show why it’s important to focus on medium to long-term net returns rather than just the last month or year.
Focus On The Signal, Not The Noise
Every investment manager has a style and a strategy – it’s the way that they think about finance and investing and it guides and shapes their investment choices. Some managers are very conservative but others are more aggressive, some have concentrated portfolios while others have very wide portfolios, and so on. We believe that each style and strategy has an inherent level of return, and that you will see that inherent level of return across the long run.
But in the short-term there will be times when any given style outperforms, and other patches where it underperforms. The market is constantly moving and the changing conditions align, or not, with certain styles of investing at different times.
In engineering there’s the idea of a signal-to-noise ratio. The signal is the information you want, and the noise is the background interference. We’re all familiar with signal-to-noise ratios in the real world, from trying to tune a radio to a particular station.
There’s a signal-to-noise ratio in investing too. The inherent level of return of the manager’s investment style and strategy is the signal. For you the investor that is the information you want to understand. But the noise is the short-term volatility – the little good and bad patches as the market briefly aligns, or not, with each strategy.
So how can we best tune out the noise and discern the signal?
Look At The Net Returns Over 3-Year And 5-Year Hold Periods
If you want to see how effective a fund manager’s style and strategy is then you need to look at their fund’s net returns over long hold periods. Shorter hold periods have a lot of noise, but that fades away as you look at longer timeframes.
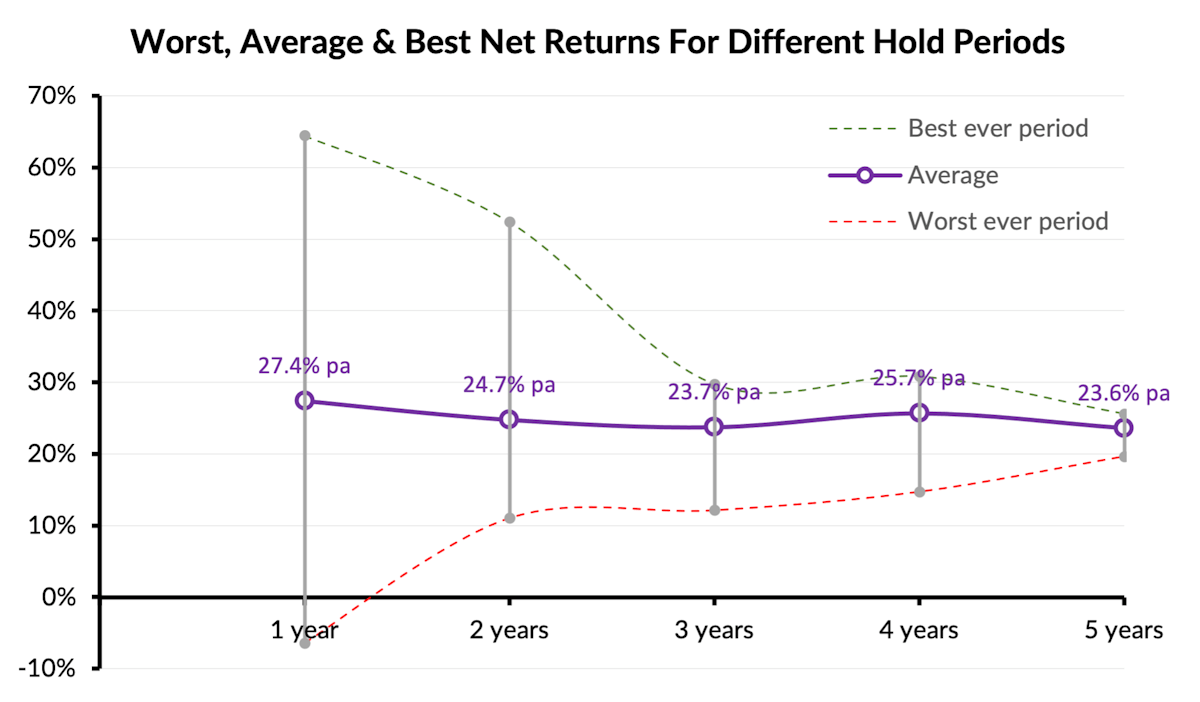
You can see this in the chart below. The chart shows the Lighthouse Global Equity Fund’s best, worst and average returns across hold periods from 1 year to 5 years. The purple line in the middle shows the average returns per annum and you’ll see it’s pretty consistent across the range of timeframes. That is the signal you’re trying to discern.
But if you look at the shorter periods, like 1- or 2-year holds, then there’s a wide range between the best ever and worst ever returns. That “noise” makes it hard to discern the signal. You could look at the annual (1-year) returns for each of the last five years and they’ll be spread across that range, making it less than obvious what net returns to reasonably expect.
However, once you get to 3-year periods and longer that spread between the best and worst ever periods has narrowed and by the time you get to the 5-year numbers the range is pretty tight. The wide variability you see from year-to-year has been squeezed out and what’s left is a clearer picture.
